LWP readership statistics 2024
The LWP's Blog · Categories: LWP meta
LWP readership statistics 2024
By Michele Lavazza · 19 March 2025
How many people visited the LWP’s site in 2024? Where were they from? Which pages did they read the most? An overview of the traffic statistics from last year.
The success of an open culture project can be gauged by several different metrics, and the sheer number of website visitors is not necessarily the most meaningful among them. For me personally, the Ludwig Wittgenstein Project’s health is best measured by looking at the vitality and enthusiasm of its community of volunteers. The level of engagement on social media is also an important factor insofar as it allows us to gather input and feedback from our audience and sometimes prioritise some activities over others.
The data about the usage of the website is available, however, and it is indeed quite interesting. Let’s take a look at it.
How is the data gathered?
The data I’m presenting was gathered through an instance of Matomo which is installed locally on the LWP’s server. Matomo is a powerful and modern platform which focuses heavily on privacy. No personal data is collected, meaning that all the information we keep record of is anonymous and cannot be traced back to individual people.
Overview
In 2024, the LWP’s website had 57,892 visits, meaning that people landed on the site an average of 158 times per day. “Visit” is a technical term in web analytics: if a person arrives at any page of the website and then navigates to multiple pages, that counts as one visit; if a person arrives at the website on two separate occasions, those count as two visits, regardless of how many pages were viewed on each occasion.
Additionally, we had 101,916 pageviews—278 per day. “Pageviews” count the total number of times any page was loaded.
The average number of pageviews per visit was thus 1.7. In other words, the average user would view between one and two pages before leaving the site.
Below is a chart where each data point corresponds to one week: for example, during the week of 2–8 September, we had 1,156 visits and 1,896 pageviews.

A few additional statistics:
- 72% of visits “bounced” (the user left the website after only viewing one page). This value is high, but not exceptionally so, as the bounce rate for any website normally falls within the range of 25–70%. The number would feel particularly unproblematic if it meant that people are likely to find the text they are looking for through a search engine, access it directly, and then leave when they are done skimming, reading or downloading it.
- The average visit duration was 1 minute 41 seconds. This average, however, is not very meaningful (the deviation is high): many users are likely to stay on a page for mere seconds (just enough to CTRL+F a quote or download the book) while a few may spend many minutes or even hours on a page if they elect to read it online as opposed to downloading it.
- The average number of actions per visit was 1.9 (this includes pageviews, downloads, clicks on outward links and internal site searches).
- A total of 1,345 total searches were performed through the site’s internal search tool using 1,034 unique keywords.
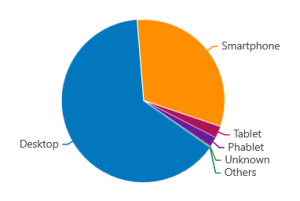
- The LWP’s website was mostly accessed from desktop devices (64% of visits), although smartphones represented a very significant portion (32%); tablets represented a minor share (2%).
Referrals
How do people find the LWP? Unsurprisingly enough, in 2024 the relative and absolute majority of users (60%) got to us from search engines. There was also, however, a very significant number of direct entries (34%): these are returning users who have bookmarked the website in their browser or know the URL and type it in the address bar. A relatively small number of visits came from links in other websites (5%) and social media (1%).
| Channel Type | Visits |
|---|---|
| Search Engines | 35,004 |
| Direct Entry | 19,664 |
| Websites | 2,617 |
| Website | Visits |
| en.wikipedia.org | 671 |
| en.m.wikipedia.org | 288 |
| aulavirtual.uv.es | 131 |
| de.wikipedia.org | 105 |
| de.wikiquote.org | 85 |
| www.ilpost.it | 79 |
| de.m.wikipedia.org | 75 |
| it.wikipedia.org | 64 |
| mokum.place | 46 |
| it.m.wikipedia.org | 45 |
| Social Networks | 591 |
| Social network | Visits |
| 275 | |
| 85 | |
| YouTube | 68 |
| 65 | |
| 35 | |
| 26 | |
| Hacker News | 11 |
| GitHub | 8 |
| Douban | 7 |
| Snapchat | 3 |
Where are our readers located?
Before addressing matters of geography, it is important to note that, as of 31 December 2024, the LWP’s library consisted of 9 texts in German, 9 in English, 13 in Italian, 6 in Spanish, 3 in Portuguese, 3 in Arabic, 2 in French, 1 in Greek, 1 in Romanian, 1 in Hindi, 1 in Turkish. The odd prominence of the Italian language, which is reflected in the geographic distribution of our readers, is explained by the fact that the LWP was initiated by an Italian (myself, I’m afraid) and that, for this reason, a lot of effort went into publishing Italian translations, especially in the early phase of the project’s life.
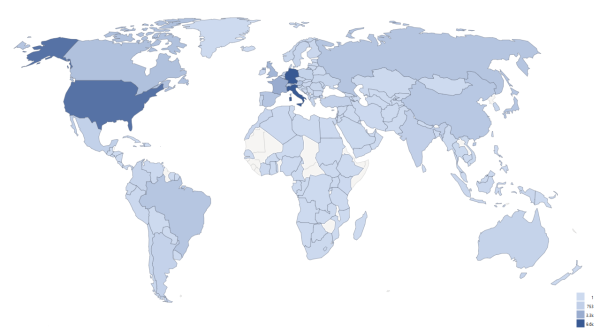
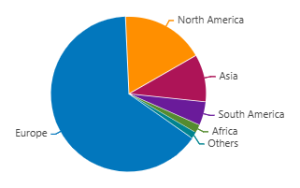
In 2024, most of our readers were located in Europe and in North America, but we were happy to find out that countries such as Russia, Japan, Brazil, and China all display quite meaningful numbers. This is welcome news for us as we actively strive to make Wittgenstein’s writings more widely available all over the world and to reach a wider audience than that which has traditionally been targeted by Western philosophy and the Western publishing industry.
Below is a world map that gives a visual hint of the distribution of our readers in 2024:
Below is a breakdown by continent:
And below is a list of the top 25 countries:
| Country | Visits |
|---|---|
| Italy | 9,581 |
| Germany | 9,575 |
| United States | 7,648 |
| France | 3,270 |
| United Kingdom | 2,575 |
| Canada | 1,806 |
| Russia | 1,505 |
| Spain | 1,484 |
| Austria | 1,439 |
| Japan | 1,406 |
| Brazil | 1,405 |
| China | 1,267 |
| Netherlands | 1,048 |
| Switzerland | 1,017 |
| India | 753 |
| Mexico | 646 |
| Türkiye | 604 |
| Argentina | 537 |
| Poland | 524 |
| Australia | 505 |
| Belgium | 456 |
| Sweden | 436 |
| Colombia | 400 |
| Portugal | 384 |
| Greece | 362 |
The data about the browser language of our users mostly confirms the conclusions that can be drawn from IP-based geolocation data. Here is a list of the top 25 browser languages:
| Language | Visits |
|---|---|
| English | 20,113 |
| German | 12,044 |
| Italian | 9,404 |
| French | 3,963 |
| Spanish | 3,352 |
| Chinese | 1,523 |
| Portuguese | 1,402 |
| Russian | 1,213 |
| Japanese | 1,128 |
| Dutch | 630 |
| Unknown | 423 |
| Turkish | 331 |
| Korean | 284 |
| Greek | 245 |
| Polish | 217 |
| Swedish | 197 |
| Danish | 170 |
| Czech | 148 |
| Norwegian Bokmål | 139 |
| Ukrainian | 109 |
| Indonesian | 100 |
| Catalan | 95 |
| Hebrew | 75 |
| Finnish | 66 |
| Romanian | 64 |
What texts are read the most?
Online
That’s a very straightforward question with a very straightforward answer: the table below provides the details (click to expand).
Most viewed pages Expand
Downloads
The ebook versions of our texts were downloaded a total of 2,680 times. The tables below provide a breakdown by format: PDF, EPUB, and MOBI (click to expand).
Most downloaded PDFs Expand
Most downloaded EPUBs Expand
Most downloaded MOBIs Expand
Trends and conclusions
Unfortunately, the data from 2024 cannot be compared easily with that from 2023. This is because, due to a technical mishap, the data from the second half of 2023 was not collected reliably. However, a quick comparison can be drawn with 2022—the first year of the LWP’s life.
The data from 2022 (which was collected using Open Web Analytics instead of Matomo) shows that the total number of pageviews for that year was 33,400 (an average of 92 per day). 11,000 of those, however, were concentrated in the first 15 days of the year, immediately following the launch of the project and an announcement on Twitter which went viral (a staggering 733 pageviews per day). The average for the rest of the year was actually around 64 visits per day.
Overall, the data hints to a steep increase in traffic between 2022 and 2024 (+146%). The same can be seen by comparing the second half of 2022 and the first half of 2023 (for which reliable data is available): 17,561 pageviews versus 23,100 pageviews (+32%).
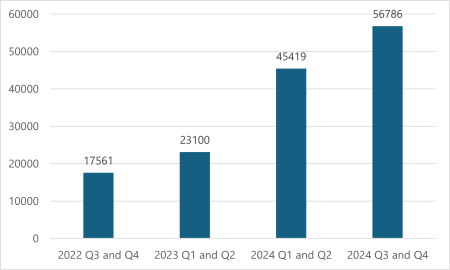
Such a positive trend is easily explained by two main factors:
- Over the years, our ranking with search engines has steadily improved. This, in turn, is for two reasons:
- Firstly, we worked on our own search engine optimisation (SEO).
- Secondly, the number of incoming links to a website that publishes valuable content always tends to organically increase over time, which in turn improves that site’s ranking with search engines; this is one of the few healthy mechanisms that still reward good work in an increasingly enshittified internet.
- We keep publishing new content, and in particular new translations, meaning that people who look up texts by Wittgenstein online are more and more likely to find the answer to their questions on our site.
Going forward, we will of course keep collecting site traffic data, and we will try to make a habit of publishing a report like this every year. As to the story the data tells—it seems to confirm that the work we are doing is appreciated and motivates us, as our friend Peter Winslow says, to keep up keeping up.
About the author
More from the LWP's blog

Happy 2026 from the Ludwig Wittgenstein Project!
Cover image: "Ludwig Wittgenstein Skjolden Norge 2024" by Vadim Chuprina, CC BY-SA 4.0


